Printing the Weather Forecast in 3D
/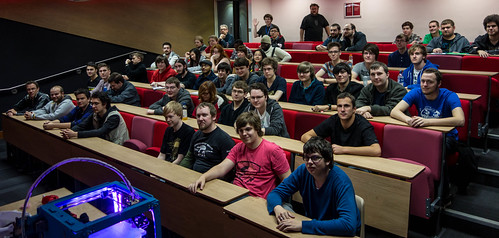
We had a good audience for the first Rather Useful Seminar. Some of them were fresh from a first year lecture and must have been feeling a mite peckish. But they stayed to the end and I hope they enjoyed it. The talk was very similar to the one I did last year, but there was a twist at the end, when I printed the weather forecast as a plastic object. Again, I brought along Una the Ultimaker, and again she behaved herself very well.
I’ve become quite intrigued with the idea of generating objects from software, and it occurred to me that with the FreeCad tool having a Python interpreter in it, we should be able to do something interesting. I’d no idea how to use Python to read a weather forecast but fortunately Catalin George Festila has done it here. So I took his methods which use the Yahoo weather feed and prints it out and made a few changes.
def weather_for_zip(zip_code):
    url = wurl % zip_code +'&u=c'
    dom = minidom.parse(urllib.urlopen(url))
    forecasts = []
    for node in dom.getElementsByTagNameNS(wser, 'forecast'):
        forecasts.append({
            'date': node.getAttribute('date'),
            'low': node.getAttribute('low'),
            'high': node.getAttribute('high'),
            'condition': node.getAttribute('text')
        })
    ycondition = dom.getElementsByTagNameNS(wser, 'condition')[0]
    return {
        'current_condition': ycondition.getAttribute('text'),
        'current_temp': ycondition.getAttribute('temp'),
        'forecasts': forecasts ,
        'title': dom.getElementsByTagName('title')[0].firstChild.data
    }
This is the code that he wrote that fetches the weather information from the Yahoo weather service and creates a list of objects that contain a forecast item for five days. The forecast information contains the highest temperature for each day, and that’s what I’m going to use to control the height of each of the columns that I print.
def main():
    a=weather_for_zip("UKXX0476")
    noOfReadings=5
    # find range of temperatures
    highest = float(a['forecasts'][0]['high'])
    lowest = highest
    for i in range(noOfReadings):
        v = float(a['forecasts'][i]['high'])
        if highest < v:
            highest = v
        if lowest > v:
            lowest = v
    # make some blocks
    plinthThickness = 3.0
    blockWidth=5.0
    blockDepth=5.0
    blockStartHeight = 5.0
    heightRange = 20.0
    rangeScale = heightRange / (highest - lowest)
    x=0.0
    y=0.0
    plinth = Part.makeBox(blockWidth*noOfReadings,blockDepth, \
        plinthThickness, Base.Vector(0,0,-plinthThickness))
    for i in range(noOfReadings):
        v = float(a['forecasts'][i]['high'])
        blockHeight = blockStartHeight + rangeScale * (v - lowest)
        block = Part.makeBox(blockWidth,blockDepth, \
            blockHeight, Base.Vector(x,y,0))
        plinth = plinth.fuse(block)
        x = x + blockWidth

    Part.show(plinth)
    Gui.SendMsgToActiveView("ViewFit")
    Gui.activeDocument().activeView().viewAxometric()

main()
The Yahoo zip code for Hull in the UK is UKXX0476. This code fetches the weather forecast data and then finds the largest and smallest temperature values (something which should be familiar to first year students). It then makes a row of five blocks, each of which has a height set by the temperature for that day. I’ve re-written it from the demonstrated code so that the coordinates make a bit more sense. The width and depth values map onto the x and y directions, with height being the z value. The code creates a little plinth and fuses a series of blocks onto the plinth. The length of each block is the temperature for that day.

This is the object that was produced by FreeCad. It represents the temperatures 12, 16,14, 17 and 16 degrees, which is the rather chilly forecast for the next few days. I sliced the design using Cura and then, after a bit of kerfuffle I managed to print out the temperature plot.
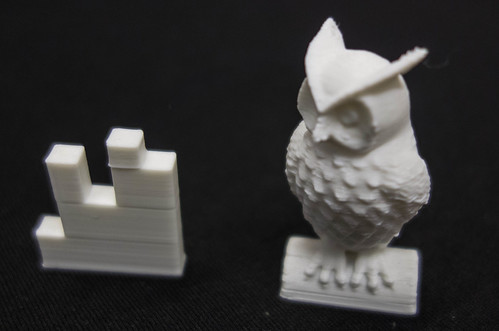
The weather forecast. And a tiny owl.
I printed it out really tiny (all of the dimension values above are in mm) but I reckon it came out quite well. I’ve since found a flaw though, in that you can’t tell which way round it is supposed to be read. Of course I could add an arrow or emboss some text to make it easier to use.
I must admit that I can’t see a huge demand for physical manifestations of the weather forecast, but I hope it brought home to folks how easy it is to grab information and turn it into something tangible. There is a lot of scope for random patterns and generating objects from mathematical formulae. And, as you can see above, it is very easy to do. I made an offer that if anyone uses Python to make an interesting object I’d be quite happy to print it out for them.
You can find the slide deck here. At the end Peter was kind enough to show some videos of his printer in action. You can find out all about the “Richmond” 3D printer at his blog here.


